Backtraderは、Pythonでのバックテストを容易にする強力なライブラリです。本記事では、Buy and Hold戦略を実装し、過去10年間のデータを使用してバックテストを行う方法を簡単に説明します。
1. 環境準備
ライブラリのインストール
# install requirement%pip install backtrader yfinance matplotlib2. ライブラリのインポート
必要なライブラリをインポートします
# import libsimport datetimeimport backtrader as btimport yfinance as yfimport matplotlib.pyplot as plt3. パラメータ設定
必要なパラメータを設定します。
## tickerと割合TICKERS = {"VTI": 0.4, "BND": 0.4, "GLD": 0.2}## 開始日時と終了日時FROMDATE = datetime.datetime(2014, 7, 1)TODATE = datetime.datetime(2024, 7, 1)4. Strategyを実装する
Strategy - Backtrader
python backtesting trading algotrading algorithmic quant quantitative analysis
www.backtrader.com

# Buy and Hold戦略の定義class BuyAndHold(bt.Strategy):def __init__(self):passdef next(self):if not self.position:for data in self.datas:allocation= data.targetcash_for_asset = self.broker.get_cash() * allocationself.buy(data=data, size=int(cash_for_asset // data.close[0]))5. バックテストを実行する
データの読みこみを行い、バックテストを実行します。
# backtraderの初期化cerebro = bt.Cerebro()cerebro.broker.set_cash(10000)cerebro.addstrategy(BuyAndHold)# yahoofinanceからデータを読み込むfor ticker, target in TICKERS.items():data = bt.feeds.PandasData(dataname=yf.download(ticker, start=FROMDATE, end=TODATE))data.target = targetcerebro.adddata(data, name=ticker)# バックテストの実行print('Starting Portfolio Value: %.2f' % cerebro.broker.getvalue())cerebro.run()print('Final Portfolio Value: %.2f' % cerebro.broker.getvalue())実行結果
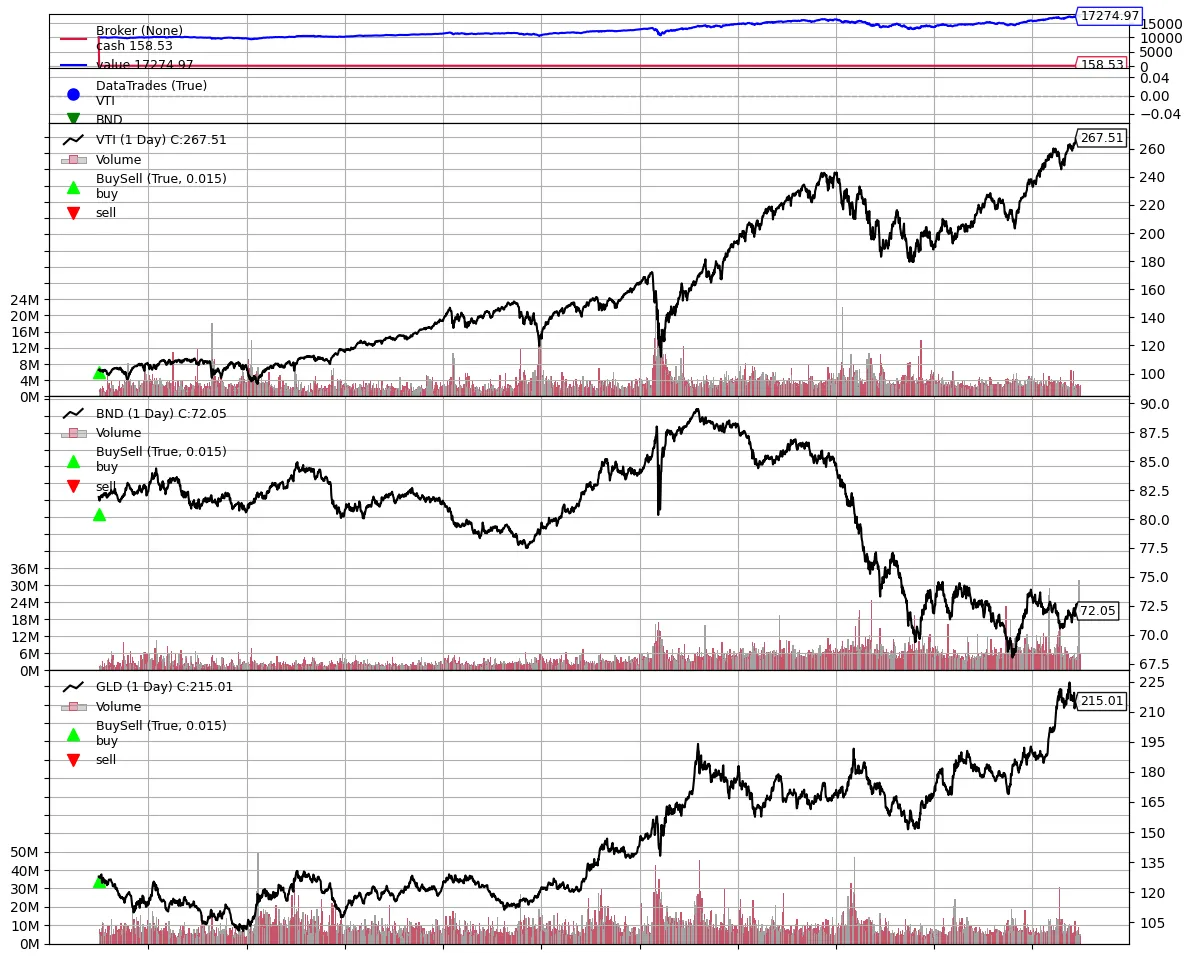
Starting Portfolio Value: 10000.00Final Portfolio Value: 17274.976. バックテストの結果を可視化
backtraderに組み込みの可視化関数があるためそれを実行します。最初のみbuyが行われていることが読み取れます。
Plotting - Backtrader
python backtesting trading algotrading algorithmic quant quantitative analysis
www.backtrader.com
plt.rcParams['figure.figsize'] = [12, 10]cerebro.plot()