Backtrader is powerful library facilitating backtest in Python. In this article, I explain method to implement Buy and Hold strategy and perform backtest using data of past 10 years simply.
1. Preparation of Environment
Installation of library
# install requirement%pip install backtrader yfinance matplotlib2. Import of Library
Import necessary libraries
# import libsimport datetimeimport backtrader as btimport yfinance as yfimport matplotlib.pyplot as plt3. Parameter Setting
Set necessary parameters.
## ticker and ratioTICKERS = {"VTI": 0.4, "BND": 0.4, "GLD": 0.2}## start date and end dateFROMDATE = datetime.datetime(2014, 7, 1)TODATE = datetime.datetime(2024, 7, 1)4. Implement Strategy

Strategy - Backtrader
python backtesting trading algotrading algorithmic quant quantitative analysis
www.backtrader.com

# Definition of Buy and Hold strategyclass BuyAndHold(bt.Strategy): def __init__(self): pass def next(self): if not self.position: for data in self.datas: allocation= data.target cash_for_asset = self.broker.get_cash() * allocation self.buy(data=data, size=int(cash_for_asset // data.close[0]))5. Execute Backtest
Perform data reading, and execute backtest.
# Initialization of backtradercerebro = bt.Cerebro()cerebro.broker.set_cash(10000)cerebro.addstrategy(BuyAndHold)# Read data from yahoofinancefor ticker, target in TICKERS.items(): data = bt.feeds.PandasData( dataname=yf.download(ticker, start=FROMDATE, end=TODATE) ) data.target = target cerebro.adddata(data, name=ticker)# Execution of backtestprint('Starting Portfolio Value: %.2f' % cerebro.broker.getvalue())cerebro.run()print('Final Portfolio Value: %.2f' % cerebro.broker.getvalue())Execution Result
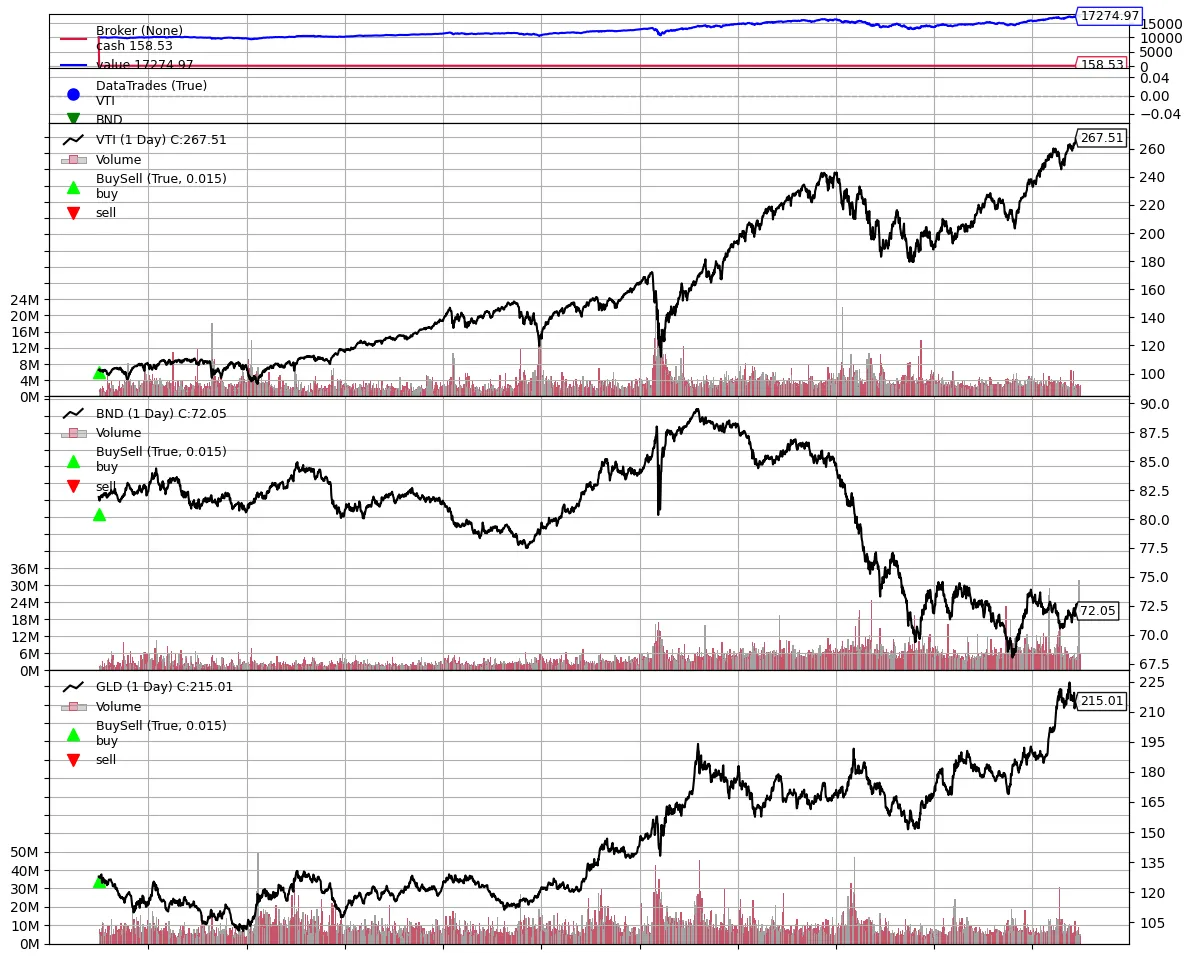
Starting Portfolio Value: 10000.00Final Portfolio Value: 17274.976. Visualize result of backtest
Since backtrader has built-in visualization function, execute it. It can be read that buy is performed only at beginning.

Plotting - Backtrader
python backtesting trading algotrading algorithmic quant quantitative analysis
www.backtrader.com
plt.rcParams['figure.figsize'] = [12, 10]cerebro.plot()