Introduction
[!NOTE] This article was generated by feeding my chaotic, personal reading notes of this massive textbook into an AI to restructure them into a readable blog post.
Following up on my previous methodology notes (Chapter 2), I’m tackling the most accessible and impactful layer next: “Chapter 5: Applications”.
The most dramatic, system-saving performance improvements almost exclusively happen at the very front lines—right inside the application code. You simply cannot avoid this chapter if you are serious about tuning.
Once again, I’ve summarized this massive chapter into a skim-friendly cheat sheet focusing purely on the critical techniques, nasty pitfalls, and core takeaways that I want to easily look back on later.
1. Don’t Just Blindly Dive Into the Code
When hunting a bottleneck, the immediate instinct is to crack open the source code and aggressively spin up a profiler. However, the author insists you must first establish a macro-understanding of the “Complete System Picture” (requirements, architecture, restrictions).
- Fix the “Hot Paths” First: Always identify the code paths executed most frequently in a production workload and optimize those completely. The book’s rule that “optimizing anything else first is inherently inefficient” definitely hurts to hear, but it’s totally true.
- Remove Unnecessary Work: Brutally cutting out processes that don’t absolutely need to run yields infinitely larger gains than trying to micro-optimize an algorithm to perfection.
2. Techniques for Boosting Performance
Here are a few architectural traits that dictate application performance.
I/O Sizing and Buffering
The basic rule: sending 128KB of data in a single I/O operation is vastly superior to sending 1KB times 128. However, if you force large I/O sizes on a database that primarily handles tiny, random reads, you’ll actually throttle performance by transferring junk data. You have to tailor it to exactly what the workload is doing.
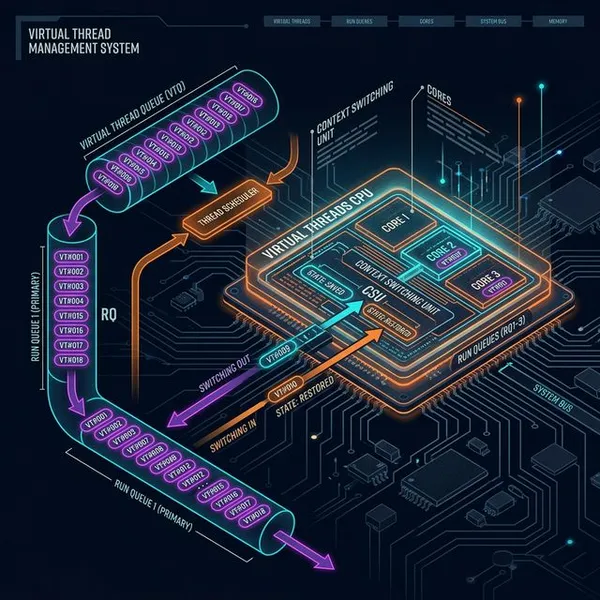
Non-Blocking I/O (Asynchronous Processing)
Standard Unix processes are physically “blocked” (put to sleep) while waiting for I/O to complete. If left unchecked, you will inevitably hit two massive deployment walls:
- You’ll need an absurd number of threads to handle concurrent I/O, rapidly exhausting system memory through stack overhead.
- Firing thousands of tiny short-burst I/O operations will murder your CPU with context-switching overhead.
This is precisely why adopting “Non-Blocking (Asynchronous) I/O” models is absolute table stakes for modern web apps.
The “USE Method” Also Applies to Software!
In my previous Chapter 2 notes, I highlighted the “USE Method” (Utilization, Saturation, Errors) for hunting hardware bottlenecks. Interestingly, the author points out that this exact same methodology perfectly applies to software resources too.
For example, if you look at a “Worker Thread Pool”:
- Utilization: The percentage of threads genuinely busy processing requests.
- Saturation: The length of the request queue (waiting for a free worker).
- Errors: The number of requests completely rejected or failed.
You can model almost any software component exactly like this—even things like “File Descriptors”. If you’re stuck in an analysis, stepping back and applying the USE method to your software architecture often directly reveals the bottleneck.
3. Analysis “Pitfalls” and Warnings (Crucial)
This is personally where I got the most value out of the chapter. It’s packed with traps that engineers constantly fall into.
The Fatal Trap of Using Debuggers
When an application looks completely hung, it’s incredibly tempting to furiously run a debugger like gdb or pstack to pull the stack trace.
However, debuggers generally freeze the target application entirely, meaning the act of debugging instantly creates a massive, catastrophic performance outage. Doing this casually in a production environment is a recipe for an absolute disaster. Always be extremely cautious.
The Myth of Long Averages
Never let your guard down just because “the 5-minute CPU average looked low.” It’s incredibly common for workloads to completely max out and bottleneck for just a fraction of a second within that interval. (It’s exactly like a highway tollbooth: the 24-hour average traffic volume might be tiny, but during rush hour, there’s still naturally a brutal 5-mile traffic jam).
Missing Function Names (The “Unknown Symbol” Problem)
When profiling languages that rely on JIT (Just-In-Time) compilers like Java or Node.js, you might fall into the trap where your function names all show up as completely unreadable [unknown] symbols. Because these languages compile and generate symbols dynamically at runtime, standard OS-level profilers are entirely blind to their internal names.
- The Fix: You must actively load auxiliary map files dynamically generated by the runtime (like
/tmp/perf-<PID>.map), or natively utilize dedicated stack helper tools likeperf-map-agentandasync-profilerexplicitly immediately after capturing the profile.
Broken Stack Traces (The [unknown] Stack)
When utilizing profilers in Java or Node.js, your stack trace might additionally frequently break vertically, completely terminating midway with an irritating [unknown] boundary frame. This is actually caused by the compiler intentionally optimizing away the frame pointer entirely to save a tiny fraction of CPU space.
- The Fix: In Java, simply boot with the
-XX:+PreserveFramePointerflag. - Doing this sacrifices roughly 1% of raw CPU performance. However, if having a crystal-clear profiler trace lets you fix a bottleneck that boosts performance by 10%, keeping this flag enabled in production is obviously a massive net win.
Conclusion
Reading this chapter made it terrifyingly clear that you need a “multi-dimensional” perspective—you can’t just know algorithmic logic; you also need to intimately understand I/O mechanics and compiler-level optimizations.
The warnings about “the sheer danger of production debuggers” and the “cause of unknown stack traces” are exactly the kind of traps that will effortlessly waste an entire working day if you don’t know them. I’m definitely keeping these burned into my mind for any future analysis tasks!