Introduction
[!NOTE] This article was generated by feeding my chaotic, personal reading notes of this massive textbook into an AI to restructure them into a readable blog post.
We’ve covered the foundations of CPU, Memory, and Networking. Now, let’s dive into “Chapter 8: File System,” which has a direct and often violent impact on application performance.
When a system slows down, we often have a spinal reflex to blame the storage, screaming “The disk I/O is slow!” But wait—the entity your application is actually interacting with and waiting on isn’t the disk; it’s the “File System.” File systems work tirelessly to hide the inherent sluggishness of disks using various clever tricks. If you leave this layer as a black box and only stare at disk statistics, you’ll never find the true bottleneck.
In this post, we’ll explore the “deep chasm” between the file system and the disk, and I’ll share a survival cheat sheet for exposing the true nature of file system latency using modern BCC/bpftrace tools.
1. Exposing the Disk Lie: Logical vs. Physical I/O
The I/O requests an application sends to the file system (Logical I/O) and the actual I/O that reaches the disk (Physical I/O) are almost never 1:1. Failing to understand this gap will lead you into an analytical dead end.
- Shrinking or Vanishing I/O: No matter how many read/write requests an app makes, physical I/O can be “zero” if they hit the page cache or if the file system cancels out the writes in memory.
- Expanding I/O: Conversely, a single “1-byte” write request from an app can explode into a massive I/O storm. The file system might expand it to its record size (e.g., 128KB), update metadata (access times, inodes), and write to journals (logs).
If you see “mysterious disk I/O” when your app is supposedly idle, it’s highly likely that background file system tasks are making their move.
2. Traps of High Intelligence: Prefetch and Write-back
File systems use sophisticated prefetching and delayed writing to avoid the agony of slow disk access.
- Prefetch (Read-ahead): When the file system detects sequential reads, it predicts “they’ll probably read the next part too” and loads data into cache ahead of time. When it hits, it’s lightning fast. When it misses, it generates a mountain of useless disk I/O and pollutes the cache.
- Write-back Caching: The file system buffers written data in the page cache in RAM and flushes it to disk asynchronously later. From the app’s perspective, writes finish instantly. However, behind the scenes, dirty data is piling up, leading to a massive burst of disk I/O when the flush finally triggers. It’s a ticking time bomb.
3. The Price of Durability: fsync(2) and Synchronous Writes
Caches in DRAM vanish when the power goes out. For critical data like database transaction logs, we use synchronous writes, but this comes with a lethal performance penalty.
- Synchronous writes mercilessly block application threads until the data reaches the disk device.
- Using flags like
O_SYNCfor every write causes your storage to scream as it forces metadata updates along with every data write. - The standard pro-tier move is to buffer writes asynchronously in the application’s address space and then call
fsync(2)at logical checkpoints to flush them in a coordinated group.
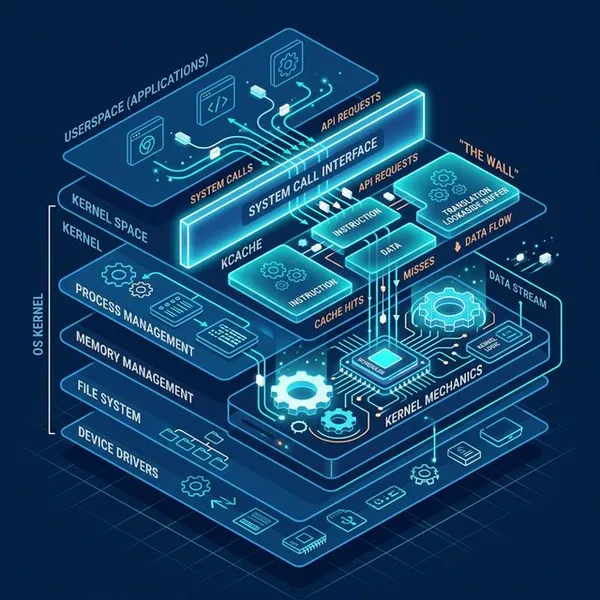
4. The Analytical Blind Spot: “VFS Latency”
OS stats typically focus on the disk device level (like iostat). However, an app can be stalled at the file system layer due to lock contention or queuing even if the disk itself is perfectly responsive.
- Measure VFS (Virtual File System) Latency: Modern performance analysis dictates that you should measure latency at the VFS layer—the common interface for all file systems—rather than just looking at the disk.
- Visualizing Bimodal Distribution with
bpftrace: Using BPF-based tracers likebpftraceto histogramvfs_readlatency makes the “bimodal distribution” instantly clear. You’ll see fast responses (microseconds) from cache hits and slow responses (milliseconds) from cache misses. It’s truly a beautiful sight to see.
5. Benchmark Pitfalls: What are you actually testing?
Most engineers who run file system benchmarks and celebrate “incredible storage speed” are actually just measuring the speed of their main memory.
- The Working Set Size (WSS) Trap: If the total size of your test files fits within the page cache in RAM, you hit 100% cache and learn nothing about the disk.
- To measure pure storage performance, you must either flush the cache with
echo 3 > /proc/sys/vm/drop_cachesto ensure a cold start or bypass the cache entirely usingO_DIRECT(Direct I/O).
Conclusion
Reading this chapter drives home how dangerous it is to judge disk performance purely by disk-level stats like iostat. The file system fundamentally transforms the nature of I/O as it passes through.