Introduction
[!NOTE] This article was generated by feeding my chaotic, personal reading notes of this massive textbook into an AI to restructure them into a readable blog post.
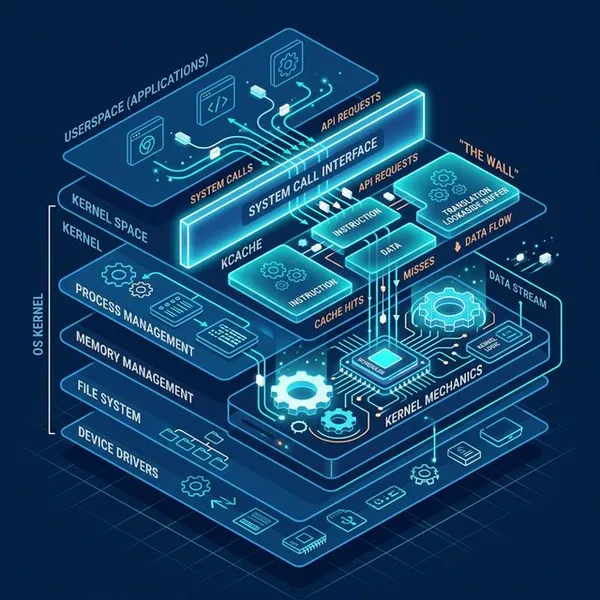
We’ve organized the foundations of the OS and application methodologies so far. Now it’s time to tackle the ultimate engine that drives all software, and one of the thickest chapters in the book: “Chapter 6: CPU”.
Once again, I’m mercilessly stripping out the pedantic hardware histories. Instead, I’ve compiled this cheat sheet exclusively loaded with survival tactics and profiling traps that you can instantly deploy when screaming, “Why is my CPU so slow?!“
1. The True Bottleneck Behind “100% Utilization”: Saturation
Once your CPU usage hits 100%, the metric becomes useless. The true bottleneck can only be grasped by looking at the number of threads desperately waiting in line for a CPU (the run queue length).
- Scheduler Latency: When there are more runnable threads than physical CPUs, threads are forced perfectly into a “run queue”. The time wasted waiting in this queue is called “scheduler latency,” and it directly causes application lag. Observing how this OS-level latency changes is a critical evaluation point.
- PSI (Pressure Stall Information): In modern Linux kernels (4.20+), the incredible PSI feature explicitly tells you the exact percentage of time your threads stalled while begging for CPU time. It is an extraordinary tool for precisely diagnosing CPU saturation.
2. Latency Culprits: “Priority Inversion” and “Migration”
Threads don’t just wait in line because the system is busy. They are often trapped by complex OS scheduler and locking mechanics.
- Priority Inversion: A terrifying scenario where a low-priority thread holding a critical lock is kicked off the CPU, meaning a high-priority thread waiting for that lock is now blocked infinitely. To prevent this catastrophe, the OS uses “priority inheritance.” In highly concurrent threaded environments, lock contention like this is usually fatal to latency.
- Migration and Cache Freezing: If the scheduler roughly moves (migrates) a thread to a different physical CPU core, the thread completely loses access to its warm L1/L2 caches on the original core, making memory access horribly slow. To avoid this, the Linux scheduler desperately attempts to keep threads running on the same CPU (maintaining CPU affinity).
3. The Core Metric for Application Threads: “Kernel Time” and “Context Switches”
If we successfully migrate from heavy OS threads to application threads, the brutal OS-level “switching overhead” should theoretically plummet. We absolutely must monitor two key metrics to prove this.
- User Time vs. Kernel (System) Time Ratio: Tools like
mpstatorpidstatreveal whether the CPU is spending time actually “executing the app (%usr)” or “grinding through OS kernel management (%sys)”. If our thread model overhaul is successful, kernel management overhead should crash, leading to a massive decrease in%sysand an increase in%usr. - Context Switch Count: When an OS thread waits for I/O, a “voluntary context switch” occurs. We can track this using the
cscolumn invmstat, or viaperf stat -e context-switches. Observing a dramatic collapse in OS-level context switches is the definitive proof that the architecture change is functioning correctly.
4. CPU “Stalls” and “IPC”
Even if the CPU appears 100% busy violently executing work, it might actually just be sitting completely idle, waiting for data to arrive from slow memory (a stall cycle).
- PMC (Hardware Performance Counters): Buried inside the CPU are dedicated hardware registers (PMCs) that track exactly how many instructions were executed, cache misses happened, or stall cycles were wasted.
- IPC (Instructions Per Cycle): By checking IPC with tools like
perf stat, you can instantly discern if the CPU is actually working efficiently. If your IPC is tragically low (like 0.2), your CPU is just stalled waiting on memory. Overclocking the CPU in this state will yield absolutely zero performance gains.
5. Profiling Traps: 99Hz and Flame Graphs
To figure out exactly what code is eating your CPU, you sample the system utilizing the perf command. However, there are massive traps in how you sample and read the results.
- The 99Hz Trap: If you sample at a clean, round frequency like 100Hz, there’s a huge risk of accidentally syncing up (lockstepping) with periodic system tasks, which violently skews your profile results (the lie of sampling). The industry standard workaround is to use an intentionally weird prime number like
perf record -F 99. - Finding “Plateaus” and “Towers” in Flame Graphs: The enormous text blocks of stack traces generated by profilers are completely unreadable by humans. We visualize them using “Flame Graphs.” You read them top-down to find “plateaus” (the wide, flat functions directly eating CPU time) and bottom-up to trace the “towers” (the ancestry of who called them). It’s the absolute fastest way to spot solutions.
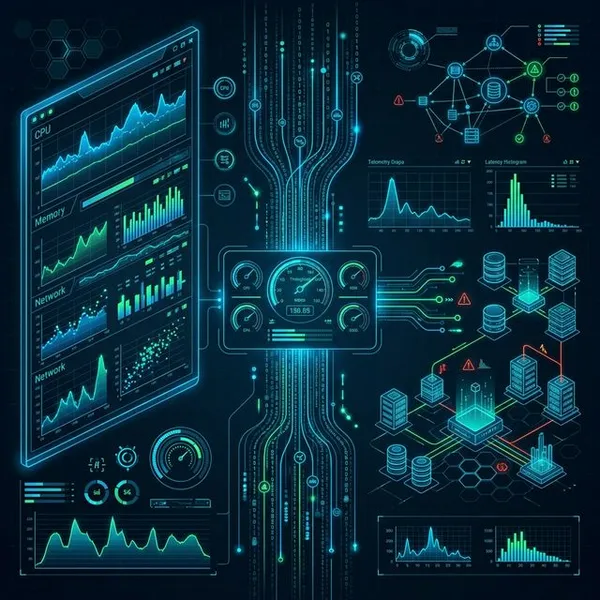
6. Exposing Averages: “Sub-Second” Analysis and FlameScope
If you lazily observe purely 1-second average utilization, you will blindly miss the fatal latency spikes that only last for a fraction of a second.
- Sub-second Offset Heat Maps: By plotting activity under one second into a heat map, you can visually spot massive disruptions—like a “blank white space” indicating the entire database was completely blocked by a lock for a few hundred milliseconds.
- FlameScope: An incredible tool developed by Netflix. It allows you to drag and select that suspicious fraction-of-a-second “perturbation” natively inside the heat map, and instantly generates a Flame Graph exclusively for that microscopic time slice. It is a wildly powerful weapon for exposing the culprit of momentary lag that averages completely hide.
Conclusion
Studying this chapter upgrades your analytical capabilities from simplistically yelling “CPU is at 100%, we need more servers!” to precisely deducing, “Are threads backed up in the run queue?”, “Is the CPU stalled waiting for memory?”, or “Are priorities inverted due to a lock?”