Introduction
[!NOTE] This article was generated by feeding my chaotic, personal reading notes of this massive textbook into an AI to restructure them into a readable blog post.
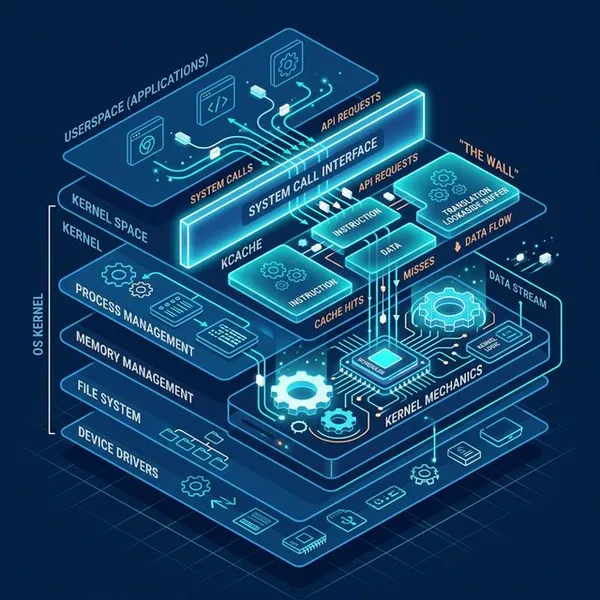
After clawing our way through the swamps of file systems and networks, we’ve finally arrived at the deepest layer of the physical world—the layer that most often drags system performance down: “Chapter 9: Disks.”
When pursuing database performance, you simply can’t ignore the characteristics of the disks responsible for ultimate data persistence. However, modern disks have evolved from simple “spinning platters” to SSDs, and further into the “virtual disks” of the cloud. Hidden behind them are multiple layers of queues and controller caches.
In this post, we’ll look at how to avoid panicking over iostat numbers and instead use modern BPF tools to expose the “true disk bottleneck.” Here’s your survival cheat sheet.
1. The IOPS Trap: Not All I/O is Created Equal
Celebrating a “million IOPS!” on a storage spec sheet is a rookie mistake. IOPS (I/O Operations Per Second) is a metric that means almost nothing on its own.
- Random vs. Sequential: Even with SSDs (and obviously with spinning magnetic disks), the throughput and latency characteristics vary wildly between sequential and random access.
- I/O Size and Read/Write Ratio: Counting a “512-byte read” and a “128KB write” as the same single IOPS is meaningless.
To talk about performance intelligently, you must always define the context: Is it random or sequential? What is the I/O size? Is it a read or a write? For sequential (streaming) workloads, you often want to lower your IOPS by using larger I/O sizes to actually increase throughput. It’s counter-intuitive but true.
2. The Lie of “100% Utilization”: Virtual Disks and Percentage Traps
Running iostat and seeing disk utilization (%util) pegged at 100% and immediately concluding “the disk is at its limit!” is incredibly dangerous.
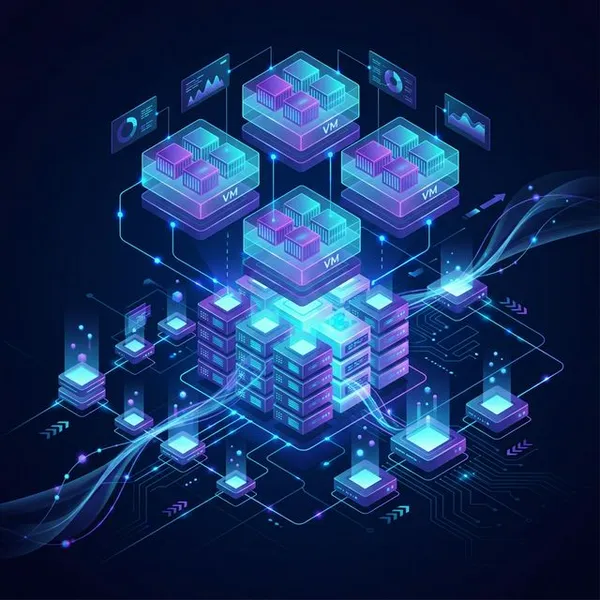
- The Virtual Disk Black Box: In cloud environments or with hardware RAID, the utilization reported by the OS might not accurately reflect the physical state of the underlying drives.
- “100% != Zero Headroom”: For virtual volumes composed of multiple physical disks, the OS might report “100% busy” if even a single disk is busy, while the others could be perfectly idle and ready for more requests. Don’t let a single percentage number dictate your strategy.
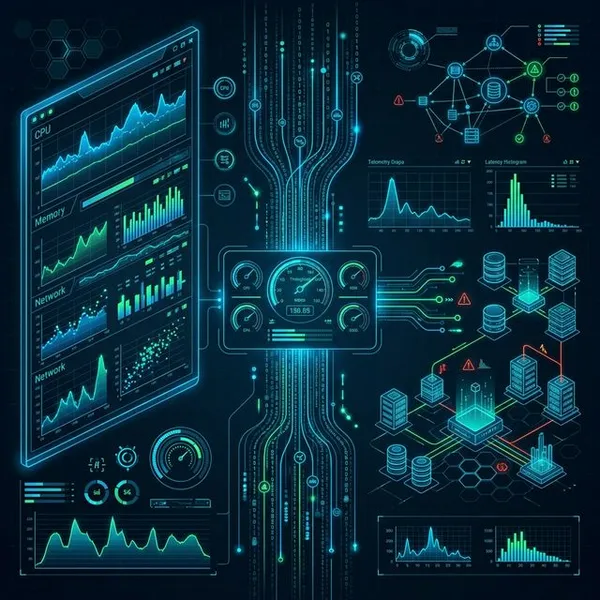
3. Average Latency Lies: Bimodal Distribution and Outliers
Never evaluate disk response times (latency) using only the “average.” Averages excel at hiding “lethal outliers”—the true culprits of performance degradation.
- The Reality of Bimodal Distribution: Disk responses are a mix of lightning-fast hits (under 100μs) from on-disk caches and painfully slow misses (several milliseconds) that must access the physical media. Mashing these together into an “average” is a distortion of reality.
- Visualize with
biolatency: Stop looking at averages; look at the distribution. Using the BCC toolbiolatency, you can histogram disk I/O latency to instantly see bimodal distributions or hidden outliers. The shape of the graph tells the story that an average can’t.
4. Hunting Mysterious I/O with biostacks
When you encounter the eerie phenomenon where disk I/O is high but your application is supposedly doing nothing, traditional tools will leave you guessing.
- “Whodunit” with
biostacks: This is a god-tier tool that displays not just the process name but the full kernel stack trace that initialized the I/O. One command can reveal that the I/O was actually triggered by metadata checks, file permission lookups, or background file system tasks—completely unrelated to your app’s core logic. - Granular Tracking with
biosnoop: Instead of looking at average latency,biosnooptracks individual I/O requests. It’s the perfect tool for pinpointing exactly which request is taking too long. Sometimes you just have to follow the trail one step at a time.
Conclusion
Reading this chapter drives home the point that a disk device is not just a container for data—it’s an “independent computer” with its own queues, caches, and microprocessors (controllers).