In this article I explain basic concept of CAPM, its merits, demerits in detail. Also introducing specific calculation steps, explaining how it helps optimization of investment portfolio.
What is CAPM
CAPM (Capital Asset Pricing Model) is a model to explain relationship between investment risk and return. Since relationship of risk and return is explained as formula, it is used to calculate expected return rate of asset.
Merits of CAPM
Basic merits are below.
- Easy: Explains relationship of risk and return with simple formula
- Indicator to evaluate risk and return: Provides standard to evaluate return against risk
By applying these merits, for example
- Judgment whether specific asset is undervalued/overvalued
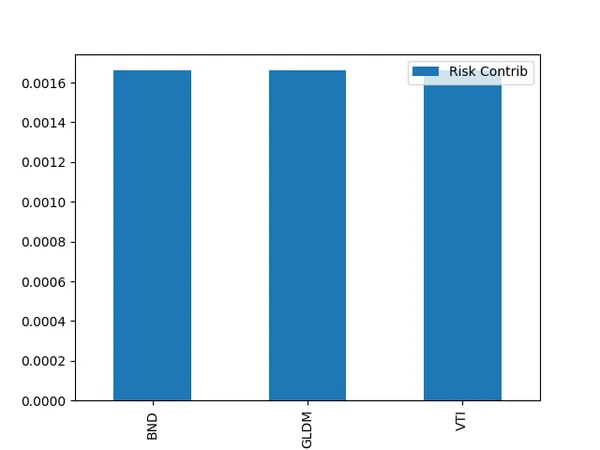
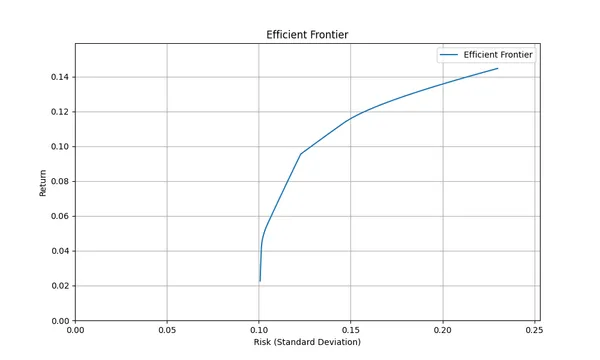
- Portfolio construction
Can be done easily.
Bad points of CAPM
- Not reflecting reality market perfectly
- Theory is built assuming information reaches all investors simultaneously and they start acting simultaneously
- Cannot reflect stock price movement due to emotion etc.
- Difficulty of Risk Free Rate Selection
- Ideally assuming no risk, but Government Bonds often used for calculation have credit risk and liquidity risk
- Fluctuation of Beta Value
- Since Beta value is calculated based on past data, it doesn’t reflect future risk accurately
- Considering only one factor
- CAPM considers only single risk factor called Market Risk Premium. However, many risk factors exist in actual investment environment (e.g. Liquidity Risk, Credit Risk, International Risk etc.)
- (Multi-factor models like Fama-French 3 factor model or Carhart 4 factor model are devised as method to solve this)
Calculation Formula of CAPM
Calculation Formula of Beta
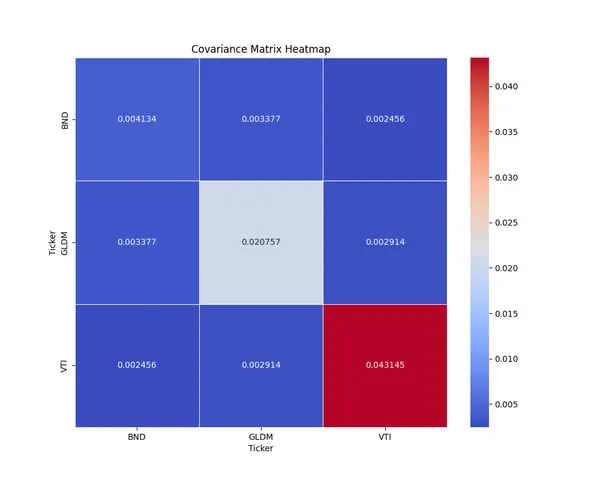
\begin{aligned} \beta_i\ &: \text{Beta of Asset i} \\ \text{Cov}(R_i, R_m) &: \text{Covariance of Asset i's return and Market Return. Shows how much 2 returns link.} \\ \text{Var}(R_m) &: \text{Variance of Market Return (r_m). Represents volatility of market return.} \\ R_i &: \text{Return of Asset i} \\ R_m &: \text{Market Return (Index etc. used when calculating)} \\ \end{aligned}Note: Determining with linear regression is possible but this one calculable only with variance and covariance is easier.
Calculation Steps of CAPM
- Calculate Beta Value of asset. Find based on past data.
- Get Risk Free Rate . 10 year Government Bond yield is often used.
- Get Expected Return Rate of Market Portfolio . Index return data is used (S&P500 if US asset, Nikkei Average if Japan etc.).
- Substitute values into CAPM equation to calculate Expected Return Rate of Asset .
Try calculating with Python
import pandas as pdimport numpy as npimport yfinance as yffrom datetime import datetime# Setting Date Rangestart_date = "2020-01-01"end_date = datetime.today().strftime('%Y-%m-%d')# Get Dataaapl = yf.download("AAPL", start=start_date, end=end_date)vti = yf.download("VTI", start=start_date, end=end_date)tnx = yf.download("^TNX", start=start_date, end=end_date) # US 10Y Bond Yield# Calculate Return (Use Log Return)aapl['Returns'] = np.log(aapl['Adj Close'] / aapl['Adj Close'].shift(1))vti['Market Returns'] = np.log(vti['Adj Close'] / vti['Adj Close'].shift(1))# Setting US 10Y Bond Yield (Use return per year)tnx['Risk Free Rate'] = tnx['Adj Close'] / 100 # Note yield as decimal# Get recent Risk Free Raterisk_free_rate = tnx['Risk Free Rate'].iloc[-1] / 252 # Convert to return per day# Combine data and remove NaNdata = pd.concat([aapl['Returns'], vti['Market Returns']], axis=1).dropna()# Calculate Covariance and Variance using pandascovariance = data['Returns'].cov(data['Market Returns'])market_variance = data['Market Returns'].var()beta = covariance / market_variance# Market Expected Return (Considering Risk Free Rate)expected_market_return = data['Market Returns'].mean() * 252expected_return_aapl = risk_free_rate * 252 + beta * (expected_market_return - risk_free_rate * 252)# Display Resultprint(f"Beta of AAPL: {beta:.4f}")print(f"Market Expected Return: {expected_market_return:.4f}")print(f"Expected Return of AAPL (by CAPM): {expected_return_aapl:.4f}")Beta of AAPL: 1.1452Market Expected Return: 0.1258Expected Return of AAPL (by CAPM): 0.1384Found by CAPM that expected return of asset is 13.8%/year. (Please note it is return investor expects, not return actually obtained)
Conclusion
Did understanding of CAPM basics and its application deepen through this article? By utilizing CAPM, investment judgment balancing risk and return becomes possible. However, since it doesn’t reflect complexity of market perfectly, it is important to consider multi-factor models together.
If you want to know other models related to portfolio construction, please utilize the link collection below.

投資ポートフォリオ構築に関するモデル記事のリンク集。資産配分・期待リターン計算・リスク管理モデルを体系的にまとめています。